Dealer`s Guide To Buy Backs Prevention

Dealer principal is chasing the dollar bill that is running away
Vector
EXECUTIVE SUMMARY
  • Most dealerships face $100,000–$130,000 in annual exposure from fraud-related buybacks and recourse—before counting prior-damage disputes or regulatory fines
  • This risk is non-regulatory and immediate: income misrepresentation ($16K–$33K/year) and identity fraud ($86K–$97K/year) show up as lender chargebacks, not theoretical violations
  • Dealers are often victims, but weak documentation shifts financial liability to the store when lenders investigate or attorneys litigate
  • Traditional best practices fail because they're manual, inconsistent, and discovered too late—not because dealers don't know what to do

In retail automotive, "compliance" typically means regulatory compliance: ECOA, FCRA, Red Flags Rule, GLBA, OFAC, Safeguards. Those obligations matter, and major enforcement actions can be catastrophic.

But for most dealerships, the probability-weighted financial exposure today doesn't come from headline regulatory events.

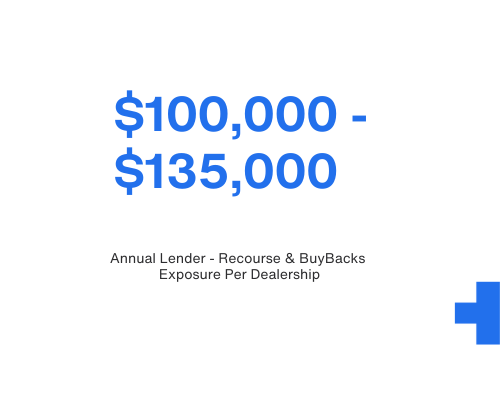
When you model industry fraud data and apply reasonable assumptions about how much loss lenders recover through recourse and buybacks, the combined exposure from fraud-tainted paper alone lands in the range of $100,000–$130,000 per dealership, per year.

Vector Right

What the Industry Fraud Numbers Tell Us

Using publicly cited fraud data (Point Predictive's $9.2B in annual auto-lending fraud and misrepresentation: 

  • 42% = income/employment fraud
  • 27% = synthetic identity/credit washing
  • 18% = true-name ID theft
  • 7% = collateral fraud
  • 6% = straw purchases

While these are lender-side losses, they can—and routinely do—shift a share of fraud and early‑default losses back to dealers through recourse provisions and loan buy‑back demands.

Plausible Per Dealer Risk Exposure.

Income/employment inflation + straw buyers
Plausible per-store exposure: ~$16,000–$33,000 per year

Identity-driven fraud (synthetic identity, credit washing, true-name ID theft)
Plausible per-store exposure: ~$86,000–$97,000 per year

Combined: $100,000–$130,000 per store, per year in buybacks and recourse—before counting prior-damage disputes, product chargebacks, or regulatory fines.

Graphics of statistics
Vector

The Structural Problem: The Dealer Pays Even When They're the Victim

Bank investigating the dealership

In many cases, the dealership isn't the bad actor. The customers overstate the income or misrepresent who will drive the vehicle.

Lenders aren't being unreasonable—they're simply unable to absorb losses on transactions where basic verification steps weren't documented. Their recourse rights exist precisely because dealers are expected to exercise due diligence as part of the origination process. They need to determine whether the dealer exercised proper due diligence and documented the customer's statements—because without that proof, the lender cannot distinguish between dealer error and customer fraud.

What works against dealers:
  • Verbal income interviews leave no defensible record
  • Handwritten apps are often shredded; final apps show "cleaned up" numbers without context
  • Digital credit tools backfire when customers enter incorrect data online, F&I manager submits corrected applications to the bank. Now there are two apps with different numbers—and the lender reasonably questions which reflects the customer's actual situation.
  • Identity verification is inconsistent; Red Flags clearance is manual and poorly documented; license verification tools are weak or used inconsistently.

In all these scenarios, the dealer may have been misled, but without strong documentation, they cannot prove it—and the financial liability defaults to the store.

Vector Right

Industry`s Best Recommended Practices. Why Do They Fail?

Below are the steps that dealers should adapt in order to protect themselves against the Buy-Backs risk exposure.

Each Deal Jacket Should Have:

  • Have customers hand-write initial credit applications
  • Customer makes and initials any corrections
  • Keep original and final apps on file
  • Ensure key fields match between versions

In reality, these steps are manual, rely on individual staff behavior in high-pressure environments, and consistency is nearly impossible with turnover and volume.

Problems are discovered only when a lender is already investigating and it is too late to do anything about it.

sofya illustration chain revised
Vector

How TDC Shifts Liability and Creates a Defensible Record

Automation -1 (1)

TDC is designed around this six-figure non-regulatory exposure. It doesn't just protect you against the regulatory exposure, but also takes into account non-regulatory financial risks—it enforces process and generates evidence.

Income & Employment Misrepresentation

Using publicly cited fraud data (Point Predictive's $9.2B in annual auto-lending fraud and misrepresentation):

Synthetic Identity, Credit Washing & ID Theft

Using publicly cited fraud data (Point Predictive's $9.2B in annual auto-lending fraud and misrepresentation):

Vector Right
From Policy to Enforcement

Almost every dealership has a binder of policies that say the right things.
Very few can prove, deal by deal, that those policies were followed, enforced, and documented.

That gap is where the $100,000–$130,000 per-year exposure lives.

TDC closes it by embedding critical steps into customer workflow, making key controls non-skippable, capturing evidence when actions are taken, and providing a unified digital deal record across income, identity, and disclosure.

The bottom line:

Regulatory compliance is necessary but no longer sufficient. The dominant financial risk today is non-regulatory—lender buybacks, identity fraud losses, and prior-damage disputes. Based on industry data and reasonable modeling, that risk easily falls in the $100,000–$130,000 per-store range.

TDC reduces that exposure by creating the enforceable, customer-authenticated records that lenders and courts actually rely on when it matters.

Vector

Understand Your Actual Exposure

Want to see how we calculated the $100K–$130K risk band for your dealership? We've built a detailed exposure model based on industry fraud data, lender recourse patterns, and deal volume assumptions.

See the methodology, assumptions, and other factors that drive six-figure annual risk for most stores.

Vector Right